7%
That is the share of countries with a specific national policy for walking or active mobility as of 2023. Not a line in a transport strategy. A dedicated policy. Seven in every hundred countries, for the one mode that nearly every person uses every day, and that starts and ends almost every other journey.
The SLOCAT Transport, Climate and Sustainability Global Status Report – 4th Edition (GSR4) shows why this number matters, and why the gap it reveals is about priorities, not knowledge. This GSR Explained was authored with Bronwen Thornton, Jim Walker and Veronica Del Motto from Walk21.
Walking is universal, and policy is starting to catch up
Active travel accounts for 22% of journeys across nearly 800 cities, and 41% of countries now refer to walking in national policy.
According to GSR4 Chapter 2.2, Sub-national Transport Pathways to Reach Climate and Sustainability Goals, walking and cycling account for 22% of journeys on average across nearly 800 cities in 61 countries, against 51% by car and 26% by public transport. That average hides a wide regional spread: cars dominate in Europe, Oceania and North America, while public transport, walking and cycling have the highest combined modal shares in Africa, Asia and Latin America. In individual cities the share is far higher. In Dire Dawa (Ethiopia), 46% of trips are made on foot. In Maputo (Mozambique), walking and cycling together account for 45.9% of the modal share.
And these figures are likely an underestimate. Modal share surveys usually count only the main mode of a commuter journey, so the walk to the bus stop, the market or the school remains unaccounted for. According to PATH’s Measuring Active Travel Success guide (2026), this can undervalue the real active travel mode share by as much as 75%.
Recognition is growing. PATH’s 2023 review of national transport policies found that 41% of countries refer to walking in a national policy. PATH’s 2026 analysis of 133 new NDCs found that 66 of them include walking and cycling, a 12% increase in global coverage since 2023. Walking has moved from the margins of transport policy into national climate commitments.
The next step is from recognition to dedicated policy: 7% of countries have a specific national policy for walking or active mobility. That step is what gives walking what every other mode already has, namely clear responsibility, measurable targets, dedicated investment and the data to track them. It matters most in the places where people walk the most, as the previous GSR Explained on transport systems in Africa showed, where reflecting walking properly in planning and investment would have the largest effect.
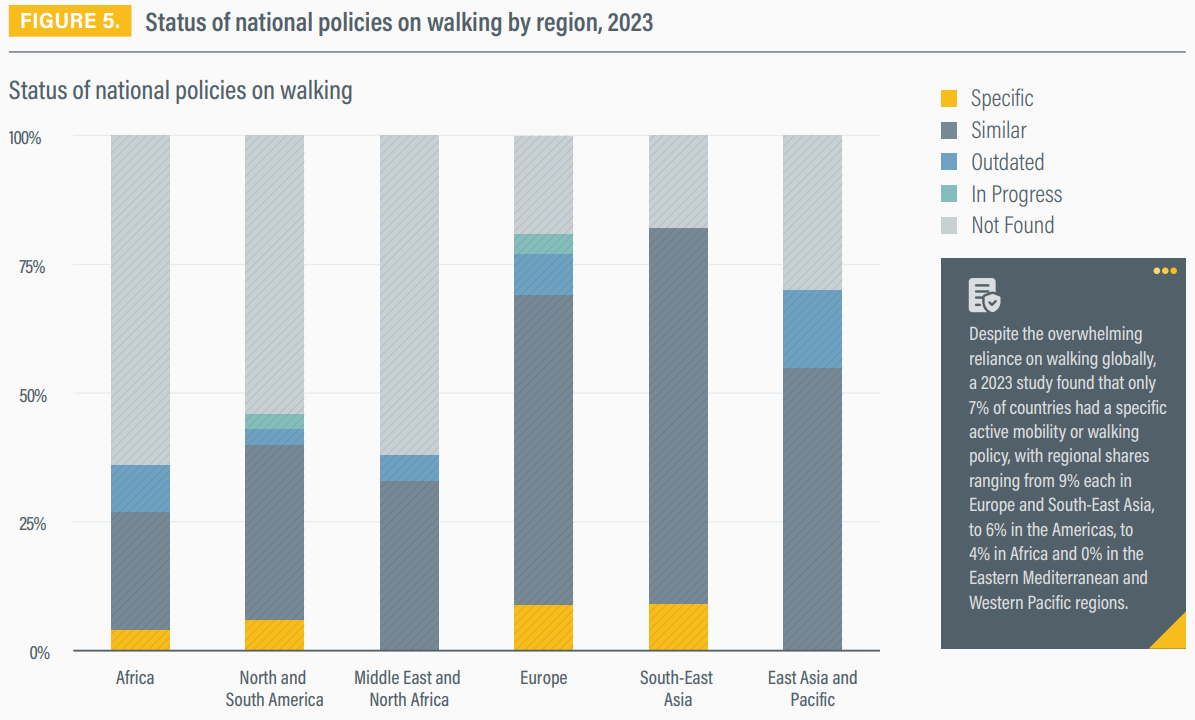
Status of national policies on walking by region, 2023. Source: GSR4 Chapter 4.3, Walking.
Walking is how people connect to everyday life
Nearly half of urban residents live within 1 km of both healthcare and education.
Walking connects people to public transport, jobs, clinics and classrooms. GSR4 Chapter 2.2 shows that in 2024, 44% of urban residents globally lived within 1 kilometre of both healthcare and education services,ranging from 35% in Africa to83% in Europe. Globally,52% of the world’s urban population has convenient access to public transport, highlighting the importance of safe and accessible walking connections as part of the wider transport system The benefits reach far beyond access :
- Health: Walking provides an accessible way to integrate physical activity into everyday life. This is important because 31% of adults do not meet recommended levels of physical activity, within activity projected to cost public health systems around USD 300 billion between 2020 and 2030 (PATH, citing WHO).
- Climate: safe walking and cycling infrastructure can cut transport emissions by 20 to 50%, one of the quickest and cheapest levers available (GSR4).
- Gender: walking is the primary travel mode for women in many countries. 68% of women say they feel safe walking alone at night, against 79% of men, an 11-point gap that persists across more than 100 countries (PATH, citing Gallup).
- Economy: every USD 1 invested in walking returns between USD 1.3 and USD 20, and walking projects create on average 9.9 jobs per USD 1 million invested (GSR4 Chapter 6.2, Evolving the Economic Appraisals for Land Transport Investments).
Safe walking environments are essential to ensuring that everyone can benefit from walking. Pedestrians represent 21% of the 1.19 million road traffic deaths in 2021, and 33% in Africa, the region with the highest fatality rates (GSR Chapter 4.3 Walking; PATH, citing WHO). Of all the roads assessed by iRAP, only 20% meet basic safety standards for pedestrians. These numbers reinforce the need to make pedestrian safety a core part of transport planning and investment.
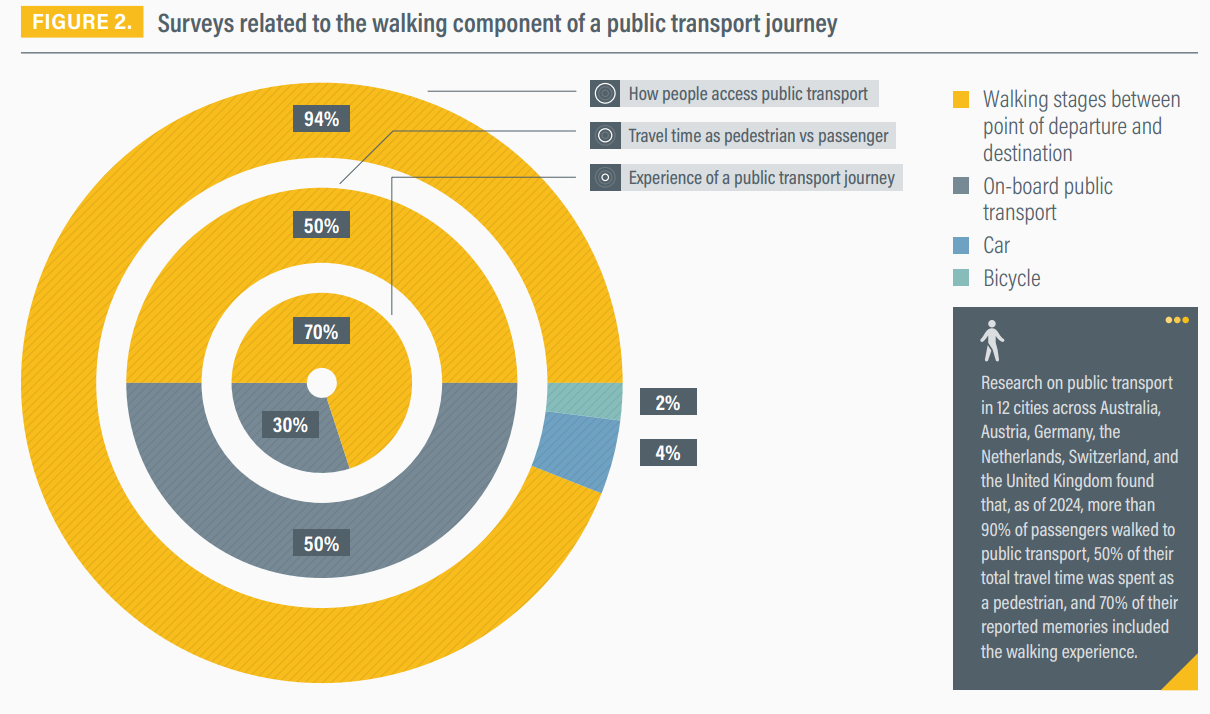
How walking shapes a public transport journey. Source: GSR4 Chapter 4.3, Walking.
Walking delivers across the Sustainable Development Goals (SDGs). Better measurement/data can make its contribution more visible.
Walking contributes to at least 14 SDG targets, but specific indicators for walking are not yet widely used to track progress. PATH’s policy framework links walking and cycling to at least 14 SDG targets, from road safety (3.6) and air pollution (3.9) to gender equality (5c), access to public transport (11.2), public space (11.7) and safety after dark (16.1.4). And yet, while physical activity is measured globally, walking itself is not consistently tracked through dedicated indicators. The gap runs straight through climate accountability. PATH’s 2026 analysis of 133 new NDCs found that 66 include walking and cycling, a 12% increase in global coverage since 2023. However, none includes a walking-specific indicator, while three countries (Colombia, Kyrgyzstan and Lesotho) have measurable cycling indicators. The most common mode of all is invisible in the system countries use to report climate ambition.
As GSR4 Chapter 2.2 puts it, walking and cycling “remain undercounted in statistics and thus neglected by policies”. What is not counted is not funded. What is not funded is not built.
From recognition to delivery
28% of countries with a walking policy have indicators to measure its impact.Turning recognition into delivery depends on systems that track what policies achieve. PATH found that 28% of countries had indicators to measure the impact of their walking policies, and that 17% of those policies had a visible, dedicated budget. National data on active travel is often more than ten years old. Each of these has a practical fix: an indicator, a budget line, a data refresh.
The same picture appears in climate plans. Of the walking actions listed in new NDCs, 76% focus on infrastructure, 13% on supporting and encouraging people to walk, and 10% on the process side: governance, regulation and financing. Infrastructure is the foundation, and the next layer is the measures that get people using it and that embed walking into how decisions are made. Road safety, the key condition for safe walking trips, appears in 5% of NDCs. Twelve countries, including China, Costa Rica and Sri Lanka, have removed walking or cycling commitments from their new NDCs, which makes holding on to what has been gained as important as adding to it.
Integrating mass public transport, walking and cycling requires around 50% less government spending than car-centric models (GSR4 Chapter 2.2). PATH’s own review notes that the countries measuring the success of their active travel programmes, mostly in the global north, were also the ones more likely to have secured long-term funding and stronger political commitment. The pattern shows up in climate plans too: 90% of the NDCs that include walking and cycling come with a visible budget (PATH, 2026). Measurement is not a technical afterthought. It is what turns a statistic into a budget line.
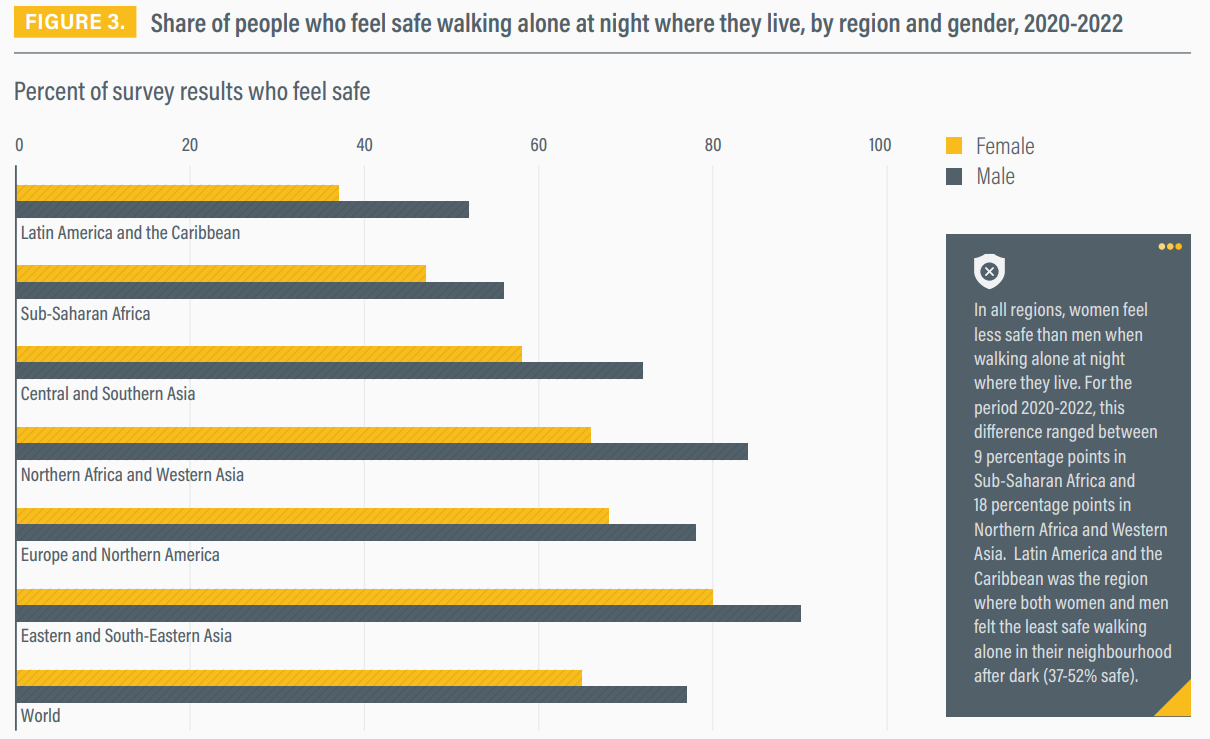
In every region, women feel less safe than men walking alone at night. Source: GSR4 Chapter 4.3, Walking.
What needs to change
The tools for measuring walking already exist. PATH’s Measuring Active Travel Success guide proposes six indicators built on existing global datasets: minutes walked per day, satisfaction, safety, security, comfort and access to public transport. Each with a target, such as 15% increase in minutes walked and cycled, or a 50% decrease in people killed or injured while walking and cycling.
The next step is putting these indicators into practice That means:
- Clear responsibility: a named ministry or agency accountable for walking.
- Measurable targets: walking-specific indicators in national transport policies and in NDCs, starting with minutes walked alongside trips counted.
- Dedicated investment: budget lines for walking that match its share of trips, not its share of attention.
- Better data: disaggregated by gender, age and ability, and collected where people walk most and walking plays an important role.
- Integration: walking planned as part of public transport and urban planning, because every public transport trip is a walking trip at both ends.
The 7% of countries with a dedicated walking policy, the 22% of journeys made on foot or by bike, and the growing presence of walking in NDCs tell a story of progress with a clear next step. Walking is already recognised. What remains is to name who is responsible, set targets that can be measured, fund them, and track what they deliver.
The UN Decade of Sustainable Transport (2026-2035) and the United Nations Climate Change Conference COP31 in Antalya (9-20 November 2026) are the moments to take that step. A Global Goal for Transport that counts vehicles, fuels and emissions, and also the people walking between them, would make the world’s most used mode visible in the system that decides where money goes. Walking does not need to be invented. It needs to be counted, funded and planned for.
Data drawn from the SLOCAT Transport, Climate and Sustainability Global Status Report, 4th edition (GSR4, 2025), and from PATH (Partnership for Active Travel and Health): Measuring Active Travel Success, Implementation Guide (2026) and Walking + Cycling in the New Generation of NDCs (2026).